
Multibeam Data Processing Software
 MarineDiscovery 12
| About Marine Discovery |
MarineDiscovery ( i.e. MD ) provides High-grade Function that enables to process of importing any type of raw data file up to outputting many kinds of charts.
MarineDiscovery 12 has enhanced Data Quality Classification, AI Noise Removal and Survey Calculation functions.
MD provides accurate and efficient managing functions that enable to integrate data and applications and save your valuable time.
Almost time for multibeam data processing is spent by noise extracting procedure. MD also provides the function that enables prefilter noise and edit noise accurately and efficiently.
MarineDiscovery12 New Features
• Data Quality Classification Function
A function that classifies data into arbitrary number of categories based on the pitch information of the data, and prioritizes high-quality data for gridding.
• MANTL Filter (AI Filter)
An automatic noise removal function using AI for noise removal and smart processing support functions.
• Addition of Survey Calculation Function
Addition of functions such as coordinate average calculation and distance/azimuth calculation.
• Other Additional Functions
Main Menu
Addition of time reference display function for recording time
Roll/Heading/TPU Filter
Gridding Support for geomagnetic file (.hosei) and gravity file (.hosei)
Grid/Ping Quality Control
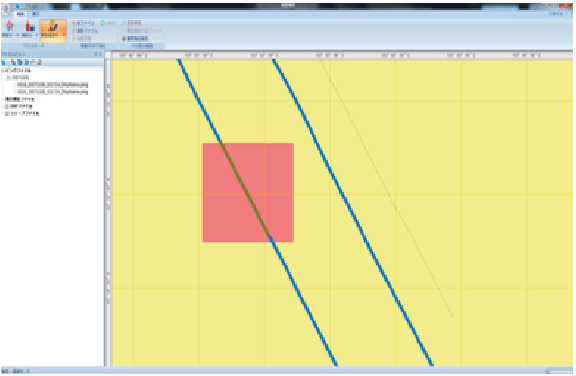
Addition of polygon file (*.shp) area calculation function
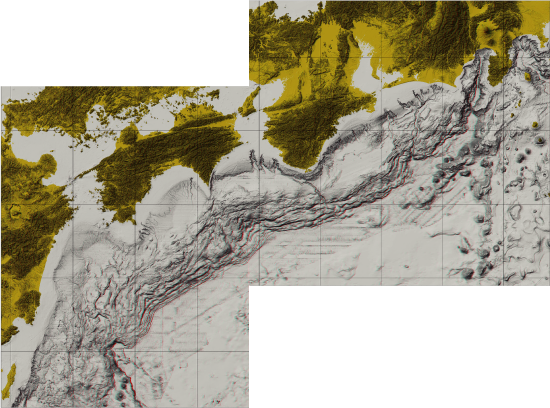
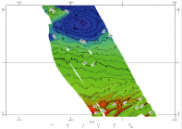
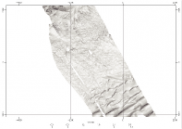
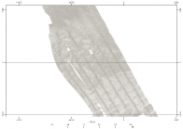
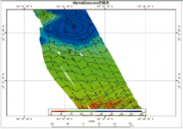
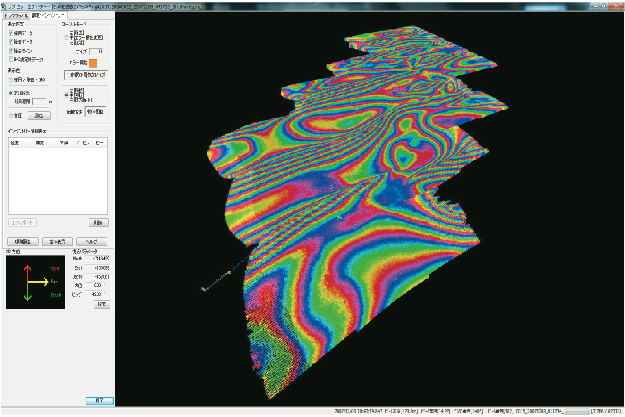
This chart is a detailed bathymetric anaglyph of Nankai Trough based on the output obtained by Marine Discovery's processing of survey data. Based on the grid data created by MarineDiscovry, creating a stereoscopic image with synthesizing shadow from two different light direction appears the detailed bathymetric anaglyph.
Nankai Trough is a submarine trough located in the south of Shikoku island. Its depth is about 4,000 m. It is said that Nankai Trough is a very active and large-scale earthquake zone. The north part of Nankai Trough is called Suruga Trough locate in Suruga Bay.
| Main Features of Marine Discovery | ||||||||||||||||||||||||||||||||||||||
|
||||||||||||||||||||||||||||||||||||||
|
■ Input of Multibeam bathymetric data |
||||||||||||||||||||||||||||||||||||||
|
□ Support of various multi-beam recording file format It corresponds to ACF, ALL, KMALL, GSF, HSX, Imagenex, LOG, XSE, MB41, NM, S7K, XTF, etc. as the data format of multi-beam acoustic sounding machine. Dual head sonar S7K became available. |
||||||||||||||||||||||||||||||||||||||
|
■ Analysis and correction of Multibeam bathymetric data |
||||||||||||||||||||||||||||||||||||||
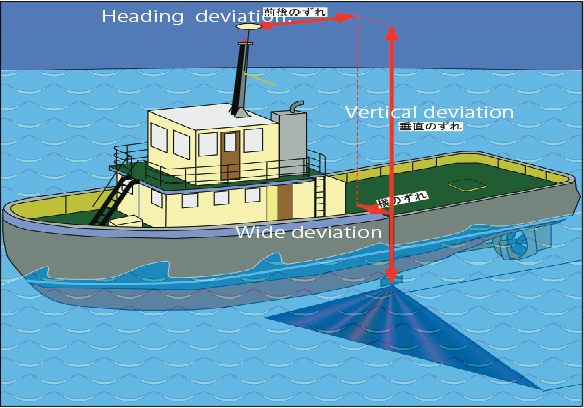
| □ Reading external files Positioning information, MRU information, and sensor water depth information can be read from external files and used for correction. □ Edit wake track |
||||||||||||||||||||||||||||||||||||||
|
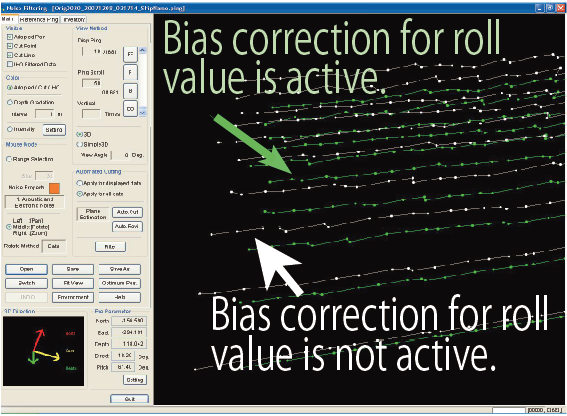
□ Various corrections to sounding data Added removing outlier function from pitch and roll data by moving average with time series.
|
||||||||||||||||||||||||||||||||||||||
|
|
||||||||||||||||||||||||||||||||||||||
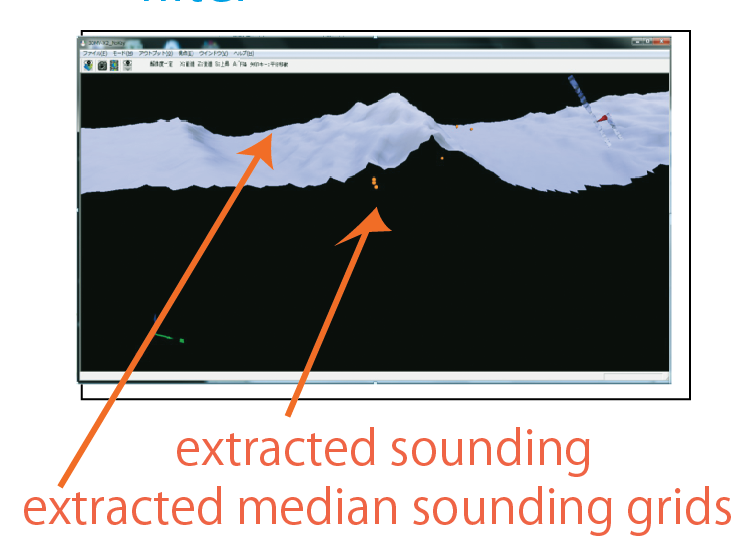
| □ Keeping a sounding accuracy by extracting error data It is available to keep a sounding accuracy by extracting error data.
□ Automatic noise reduction
|
||||||||||||||||||||||||||||||||||||||
|
□ Noise Removal for point cloud data Added the sync function of number of display ping and scroll ping.
|
||||||||||||||||||||||||||||||||||||||
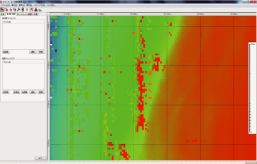
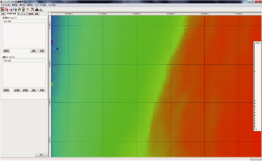
| □ Significant reduction of noise removal work time by CUBE CUBE (Combined Uncertainty and Bathymetry Estimator) is one of the methods to create bathymetric data. In this method, the water depth value of the grid and its PU (Propagated Uncertainty) are assumed by TPU (Total Propagated Uncertainty) and statistical techniques. This method was developed by Dr. Brian Calder (University of New Hampshire) and has been licensed to our company. CUBE filter compares the water depth at the grid obtained by CUBE and known depth points and removes automatically the water depth points where depth difference are more than the threshold. It has world widely reported that the working time of noise removal were dramatically shortened as compared with the conventional noise removal operations by utilizing CUBE filter noise rejection. The following images shows the comparisons of the grid before removing noise and the grid obtained by the CUBE function in MarineDiscovery. The grid obtained by CUBE becomes totally smooth and a bathymetric image with high reproducibility. □ Embedding noise extracting data |
||||||||||||||||||||||||||||||||||||||
|
||||||||||||||||||||||||||||||||||||||
|
□ Efficient data processing
|
||||||||||||||||||||||||||||||||||||||
| ■ Management of Multibeam bathymetric data | ||||||||||||||||||||||||||||||||||||||
| □ Creating random water depth data (Correct data) Random water depth point data can be output as correct data after inspection. □ Management of Inspection and Survey Quality ICT |
||||||||||||||||||||||||||||||||||||||
|
|
||||||||||||||||||||||||||||||||||||||
|
□ Sounding density ICT |
||||||||||||||||||||||||||||||||||||||
|
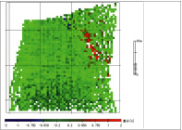
□ Quality control by visualizing
Added function for 3D displaying survey planning line and file of given point. Also by including QCtools provided from HydrOffice, the function of extracting spike noise by using Gaussian curve or Laplacian was available. |
||||||||||||||||||||||||||||||||||||||
 |
 |
 |
||||||||||||||||||||||||||||||||||||
| Flat view | Three-dimensional view | Cross section view | ||||||||||||||||||||||||||||||||||||
|
|
|
|
||||||||||||||||||||||||||||||||||||
| □ Quality evaluation tool for survey results QUEST (OPTION) This tool can logically evaluate the quality of hydrographic survey results conforms to the standards. This tool makes it possible to improve the efficiency of the inspection of the hydrographic survey work product.
|
||||||||||||||||||||||||||||||||||||||
|
■ Output of Multibeam bathymetric data |
||||||||||||||||||||||||||||||||||||||
| □ Gridding and Contouring For visualization of multibeam data, it is possible to create grid files or multiple grid with water depth values arranged at equal intervals and depth contour. |
||||||||||||||||||||||||||||||||||||||
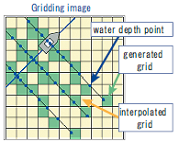
Grid data are generated only in the grid points where water depth data are obtained. Interpolation is also possible. As each grid data value, shallowest value or average value can be set.
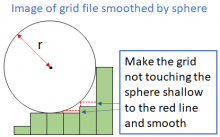
If you set to output the projected grid file, you can smooth by sphere. Place a sphere of radius r on top of the grid, and make the grid that does not touch the sphere shallow and smooth so that it touches the sphere.
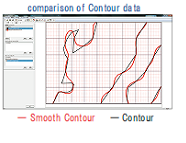
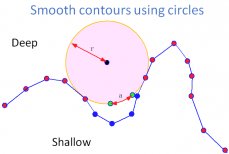
Contour data is calculated from the grid file or random grid file. The depth contour is calculated dynamically from a triangle (TIN). The depth contour is not include part of no grid data. The grid size can be changed dynamically for smooth contours.
You can smooth contours to deep side. Roll a circle with radius r from the deep side along the contour line, delete the vertices where the circle does not fit, and fill it with arcs instead. |
|
|||||||||||||||||||||||||||||||||||||
| □ Projected coordinate system MD supports a rotating coordinate system centered on an arbitrary origin. (MD also supports plane orthogonal coordinate system and UTM coordinate system, etc.)
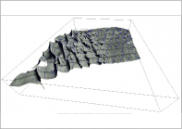
□ Various file output (→ a 3D PDF Sample [a 3D image of Wreck]) Added function of converting LandXML to TIN. |
||||||||||||||||||||||||||||||||||||||
|
||||||||||||||||||||||||||||||||||||||
 |
 |
 |
||||||||||||||||||||||||||||||||||||
| Contour | Track | Depth | ||||||||||||||||||||||||||||||||||||
 |
 |
 |
||||||||||||||||||||||||||||||||||||
| Inclination | Sounding | 3D | ||||||||||||||||||||||||||||||||||||
 |
 |
|||||||||||||||||||||||||||||||||||||
| Difference | Cross section | |||||||||||||||||||||||||||||||||||||
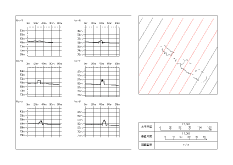
| □ Charting MD provides charting functions that display grids, random grids, contours or track, and output data to printers, plotter or PDF. Images which freely place index map, drawing information, or scale can be made. DXF, Shapefile, GeoTIFF file can be displayed on the background of the image.
|
||||||||||||||||||||||||||||||||||||||
 |
 |
 |
||||||||||||||||||||||||||||||||||||
| Example of creating a chart | Example of creating a water depth chart | Example of creating a chart with index map | ||||||||||||||||||||||||||||||||||||
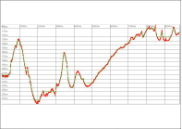
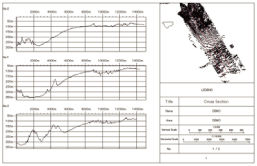
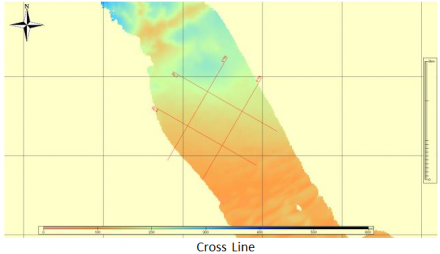
| □ Creating cross-sectional images Cross-section lines are automatically created by setting of starting and end points of latitude and longitude, range of creating section lines, and line spacing of section lines. On the basis of the created grid and the section line, cross-sectional images are automatically created. Display range, scale, color, etc. of a cross-sectional image can be configured.
|
||||||||||||||||||||||||||||||||||||||
 Example of creating cross-section lines Example of creating cross-section lines
|
||||||||||||||||||||||||||||||||||||||
| □ Creating sounding map By extension function, it is possible to create a water depth map by executing water depth selection (water depth point for water chart) by various algorithms such as evaluation using Voronoi diagram, independent shallow judgment function, etc. in addition to TIN evaluation. □ Creating 3D bathymetric model (TIN model) ICT □ Creating Bird's Eye View ICT |
||||||||||||||||||||||||||||||||||||||
| ■ Other convenient functions | ||||||||||||||||||||||||||||||||||||||
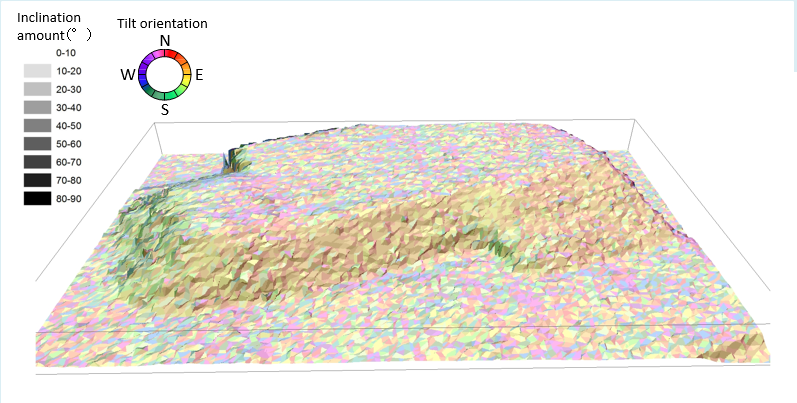
| □ Quantity calculation · Form management ICT MD provides the function of Calculation of the amount of dredged soil or dam sediment. In quantity calculation, MD calculates the amount of soil less than the standard water depth including excavation. In form management, MD calculates the amount of soil or the difference without excavation. Each calculation result can be visualized by the MD Viewer. □ Inclination calculation
|
||||||||||||||||||||||||||||||||||||||
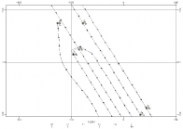
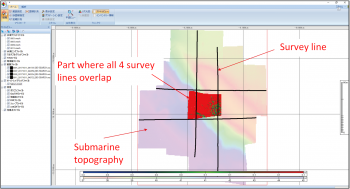
| □ Improved survey line planning tool The survey line planning tool has improved. In addition to making a rectangle range survey line, you can conveniently create orthogonal lines to the center line, parallel lines, and cross lines. The extension line can also be inserted with one click.
□ Survey Calculator
|
||||||||||||||||||||||||||||||||||||||
|
■ Importable Data Formats |
||
|
||
| ACF | Multibeam echo sounder - HYDROSWEEP (Teledyne Reson) | |
| ALL, KMALL | Multibeam echo sounder - EM series (Kongsberg) | |
| GSF | Generic Sensor Format (SAIC Ⓡ) | |
| HSX | HYPACK Hydrographic Survey Software (HYPACK Ⓡ) | |
| LOG | Multibeam sonar - HS-600F (Furuno) | |
| XSE, MB41, NM | Multibeam System - SeaBeam (L-3 ELAC Nautik) | |
| XTF | eXtended Triton Format (Triton Imaging Ⓡ) | |
|
|
||
|
||
| Tide, heading, upset, water depth can be imported from external files (CSV format). | ||
| ■ Operating environment | ||
| OS | Windows 10, 11 (64 bit) | |
| CPU | Intel Core i7 2600K or above | |
| Memory | 16 GB or more | |
| Hard Disk | 50 GB or more | |
| Graphics board | Supports DirectX 9.0c and above NVIDIA RTX3050 or above AMD Radeon RX 5500 XT or above recommended |
|
| Monitor | Resolution: 1400×1050 pixels or higher Number of colors: True Color 32 bit |
|